
Lizardo
Lizardo

Meet Asher! This year for Christmas, one of our children decided they really wanted a bearded dragon. They asked Santa for the equipment (tank, etc.) and then after Christmas we all went out and bought the dragon. Bearded dragons are great pets, apart from all the live roaches we now need to keep stored in our apartment, and the constant fear that they’ll escape and crawl all over me while I sleep. That aside, they’re great.
So, we have this new member of our family, and he (or she…TBD) is pretty easy to care for, but does have some strict requirements around temperature and humidity. We live in an apartment building where we have zero control over the heat and since our heat is hot water radiator based our rooms get extremely dry in the winter, requiring several humidifiers. We needed a way to monitor the tank and make sure that Ash was in a good spot.
I love tinkering with electronics, so this was a perfect opportunity to put something together that was both fun and useful. Here we go….
Requirements
Reqs were pretty easy.
- Monitor temperature
- Monitor Humidity
- Temp and humidity need to be track on both the basking and ambient sides of the tank separately
- Provide historic data for review
- Be accessible from the public internet
- Optional: Web Cam Support
Shopping
First think I needed to work out was the microcontroller platform I wanted to use. I looked at several options (arduino, feather, pi), but given that I wanted to have support for a web cam in the future, I thought it made most sense to go with a Raspberry Pi based platform. I also happened to have an extra Pi 3 B laying around.
Knowing that I was going with a Pi then opened the question of what sensors I needed. I initially wasn’t thinking enough about the fact that on the Pi I’d likely be using Python, so I wasn’t really thinking much in terms of sensors with existing Python libraries. This was a bit of a mistake.
LESSON: If you plan to use python…maybe think about looking for sensors that have a python library available….duh.
So, in my ignorance, I went with the SHT30 from Adafruit. This is a nicely packaged version of the Sensiron SHT-30 digital sensor. It uses I2C for communication, which is another plus, but I didn’t find a library…although I do think there is one out there..I just couldn’t find it.
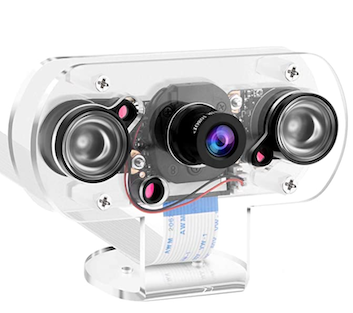
I did buy a camera, and have tested it, but I’ll post separately about that. I wanted an IR camera, and I found this one that has a nice housing with added IR lights.
MakerFocus Raspberry Pi 4B Camera IR Camera Module
For connecting the sensors to the pi I wanted something that was clean. I ended up going with a Raspberry Pi EZ-Connect hat. I really like this hat, but I did run into a few minor issues that I’ll discuss when I get to the I2C topic. In short, if I did it again, I may have looked for an I2C multiplexer hat instead of something more generic (ex. i2c 8 way hat).
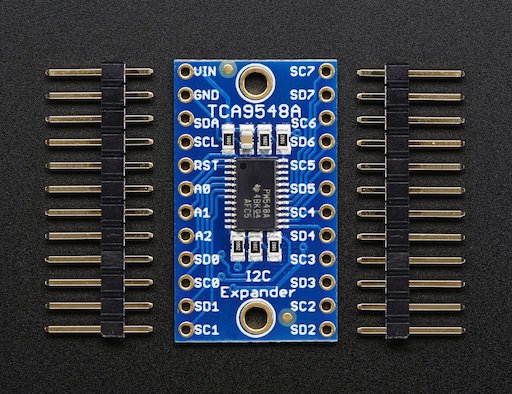
Since I didn’t have a multiplexer in the pi ez-connect, I also picked up a tca9548a I2C multiplexer. More on that below.
Finally, the enclosure. I happened to have an old enclosure lying around that fit a raspberry pi, for another project I had teed up that I never got to. I dont have the link to that, but you can find many suitable enclosures online. Just make sure you buy one tall enough to house whatever hat you put on the pi, as well as any wiring or other components you include.
Inter-integrated Circuit Bus (I2C) Challenges
Many of the sensors and components you find out there will leverage I2C for communication. You can read all the details on I2C here, but in short…all of your sensors are connected with four wires/pins:
- Vin (power)
- GND (ground)
- SCL (clock)
- SDA (data)
Your micro controller likely provides at least one I2C bus. Raspberry Pi, depending on the model, actually has several. You can also connect multiple sensors to a single I2C bus, because all sensors have a unique address. For example, the address that is hard wired into the SHT30 sensor is 0x44.
This is great, except for one problem. You can’t have two sensors with a common address on the same I2C bus. Most sensors will have a jumper you can adjust, or other setting you can apply to change the address. Unfortunately, while you can change the address of the SHT30 sensor, in the housing provided by Adafruit you don’t have that access.
So, how do you solve this? First, I went down the path of enabling the second I2C bus on my Pi 3 B, but I had a TON of time finding good documentation, and apparently there may be pull up resistors needed, etc, etc. I pretty quickly bailed on this once I saw the option to use an I2C multiplexer. This was nice because it solved my current problem, and opened up the option to easily add more sensors down the road, without worrying about the Raspberry Pi I2C bus setup.
The TCA9548A multiplexer (shown below) connects to your pi on the I2C port at address 0x70 and allows you to connect up to 8 I2C devices which are programmatically selectable. So once connected, you can tell it which channel you want to talk to, and then just call it as if it isnt there, routing you directly to the target I2C device.
The build
Ok, now we have all our parts, lets assemble!
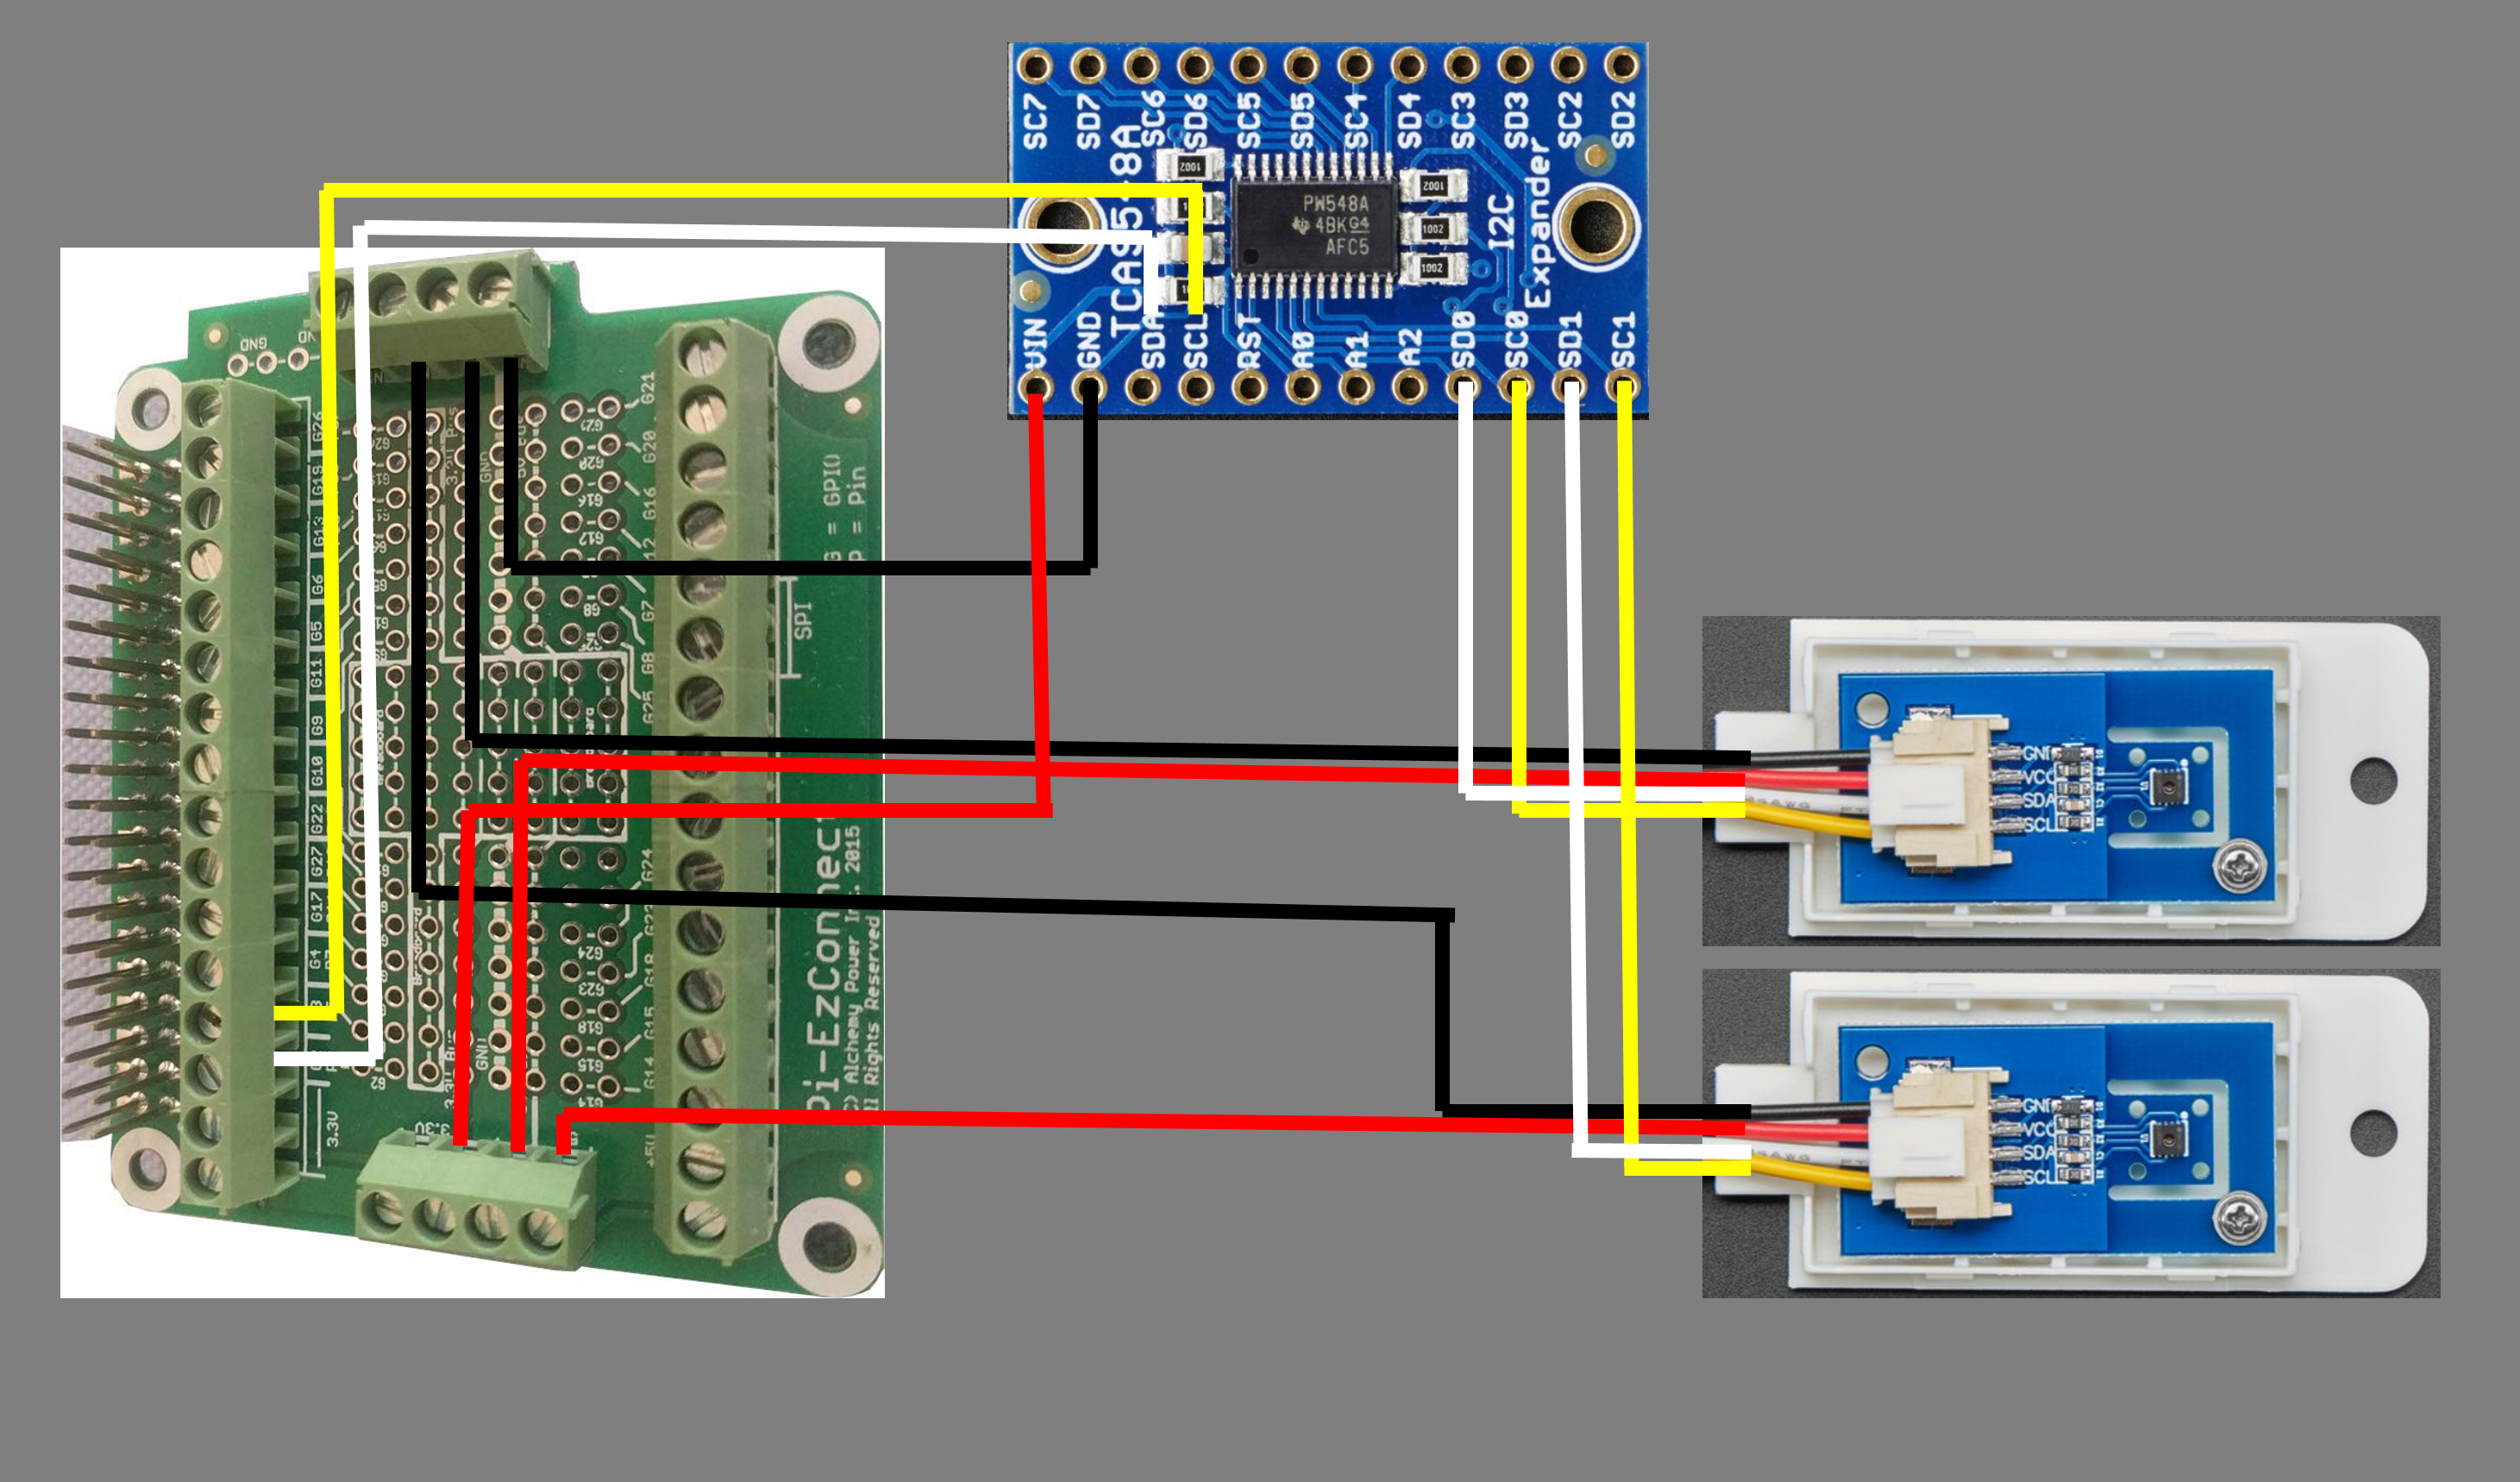
Sorry, I know the diagram isnt very polished, but I had trouble finding all the components I needed in Fritzing, so I just threw this together quick in PowerPoint. The wiring it pretty easy.
- Connect the grounds from all of your devices (2 SHT30s and the TCA9548) to the ground connectors on the EZ-Connect hat
- Connect the SDA (white wire) from G2 on the hat to the SDA pin on the TCA9548
- Connect the SCL (yellow wire) from G3 on the hat to the SCL pin on the TCA9548
- Connect the SD0 and SC0 pins on the TCA9548 to the yellow (SCL) and white (SDA) wires on your first SHT30 sensor
- Connect the SD1 and SC1 pins on the TCA9548 to the yellow (SCL) and white (SDA) wires on your second SHT30 sensor
- Finally, connect the power lines from both sensors and your TCA9548 to the 5V header connectors on the EZ-Connect hat
Fire up your pi and enable your I2C ports and check for the multiplexer:
# Run raspi-config
sudo raspi-config

# Select '3 Interface Options'
# Select 'I5 I2C Enable/disable automatic loading of I2C kernel module'
# Select yes when asked 'Would you like the ARM I2C interface to be enabled?'
# Reboot your pi

# Once restarted, run i2cdetect to make sure your multiplexer is being found
pi@lizardo:~ $ sudo i2cdetect -y 1
     0  1  2  3  4  5  6  7  8  9  a  b  c  d  e  f
00:                         -- -- -- -- -- -- -- --
10: -- -- -- -- -- -- -- -- -- -- -- -- -- -- -- --
20: -- -- -- -- -- -- -- -- -- -- -- -- -- -- -- --
30: -- -- -- -- -- -- -- -- -- -- -- -- -- -- -- --
40: -- -- -- -- 44 -- -- -- -- -- -- -- -- -- -- --
50: -- -- -- -- -- -- -- -- -- -- -- -- -- -- -- --
60: -- -- -- -- -- -- -- -- -- -- -- -- -- -- -- --
70: 70 -- -- -- -- -- -- --
NOTE: The TCA9548 multiplexer is address 0x70 and the SHT30 is address 0x44. You can see both above, although you will only see the SHT30 after you’ve run the code below which sets the multiplexer channel.
The code
We want our code to run regularly, read the data, and make it available to visualize. I came across this great blog post from Chris Collins that shows pretty much exactly what I wanted to do, but it needed to be updated to use the SHT30 sensor and my multiplexer. The nice thing about this is that it uses the Linux Journal and SystemD to keep this running as a service, but it also uses Prometheus to store the data which can then be vizualized in a tool like Grafana.
Fortunately I already had Prometheus and Grafana running on an Azure Kubernetes Service cluster that I have connected to my home network over S2S VPN, so I was able to reuse that. You could, of course, set up your own local instance of prometheus in a container, or run a local Kubernetes cluster and install it there.
After some trial and error, my final code looked like this (available here):
#!/usr/bin/env python3
from Adafruit_GPIO import I2C
import logging
import time
import smbus
from prometheus_client import Gauge, start_http_server
from systemd.journal import JournalHandler

# Setup logging to the Systemd Journal
log = logging.getLogger('sht30_sensor')
log.addHandler(JournalHandler())
log.setLevel(logging.INFO)

# The time in seconds between sensor reads
READ_INTERVAL = 5.0

# Create Prometheus gauges for humidity and temperature in
# Celsius and Fahrenheit
# Sensor 1 - Multiplexer Channel 0
gh = Gauge('sht30_humidity_percent','Humidity percentage measured by the SHT30 Sensors', ['scale'])
gt = Gauge('sht30_temperature','Temperature measured by the SHT30 Sensors', ['scale'])

# Initialize the labels for the temperature scale
gh.labels('sensor0_humidity')
gt.labels('sensor0_fahrenheit')
gh.labels('sensor1_humidity')
gt.labels('sensor1_fahrenheit')

tca = I2C.get_i2c_device(address=0x70)

def tca_select(channel):
    """Select an individual channel."""
    if channel > 7:
        return
    tca.writeRaw8(1 << channel)

def read_sensors(channel):
    try:
        # Initialize the SHT30 sensor
        # Select channel 0
        tca_select(channel)
        # Get I2C bus
        bus = smbus.SMBus(1)
        # SHT30 address, 0x44(68)
        # Send measurement command, 0x2C(44)
        # 0x06(06)        High repeatability measurement
        bus.write_i2c_block_data(0x44, 0x2C, [0x06])
        # SHT30 address, 0x44(68)
        # Read data back from 0x00(00), 6 bytes
        # cTemp MSB, cTemp LSB, cTemp CRC, Humididty MSB, Humidity LSB, Humidity CRC
        data = bus.read_i2c_block_data(0x44, 0x00, 6)
        # Convert the data
        cTemp = ((((data[0] * 256.0) + data[1]) * 175) / 65535.0) - 45
        fTemp = cTemp * 1.8 + 32
        humidity = 100 * (data[3] * 256 + data[4]) / 65535.0
    except RuntimeError as e:
        # GPIO access may require sudo permissions
        # Other RuntimeError exceptions may occur, but
        # are common.  Just try again.
        log.error("RuntimeError: {}".format(e))

    if humidity is not None and cTemp is not None and fTemp is not None:
        gh.labels("sensor{0}_humidity".format(channel)).set(humidity)
        gt.labels("sensor{0}_fahrenheit".format(channel)).set(fTemp)

        log.info("Sensor {0} - Temp:{1:0.1f}*F, Humidity: {2:0.1f}%".format(channel, fTemp, humidity))

if __name__ == "__main__":
    # Expose metrics
    metrics_port = 8000
    start_http_server(metrics_port)
    print("Serving sensor metrics on :{}".format(metrics_port))
    log.info("Serving sensor metrics on :{}".format(metrics_port))

    while True:
        read_sensors(0)
        read_sensors(1)
In short, the code above does the following:
- Imports all the needed libraries for I2C wire communication, Journal and Prometheus
- Creates the Journal logger
- Creates the Prometheus metrics and labels (Note: I chose to use labels to identify each sensor rather than having separate metrics, but that was a personal choice. Separate metrics would also work)
- Provides a method to switch the I2C channel as needed
- Provides a method that selects the channel and then reads the data from the SHT30, serving that up in both the journal logs as well as to the prometheus http endpoint which will later be scraped
- I call the ‘read_sensors’ twice. Once for SD0/SC0 and once for SD1/SC1
Continuing along with the doc Chris wrote, we create the systemd service definition, which looks like this:
[Unit]
Description=SHT30 Sensor Metrics Service
After=network.target
StartLimitIntervalSec=0

[Service]
Type=simple
Restart=always
ExecStart=python3 /opt/lizardo-metrics/lizardodaemon.py

[Install]
WantedBy=multi-user.target
I left both files in my source directory and created symbolic links to the service definition, as shown below. Obviously, you should implement as you see fit, but this works for me.
# From my source directory
sudo ln -s $(pwd)/lizardo-metrics.service /etc/systemd/system/lizardo-metrics.service
sudo ln -s $(pwd)/lizardodaemon.py /opt/lizardo-metrics
Finally, we can start our service and see what we have:
# Enable the service
sudo systemctl enable lizardo-metrics.service

# Start the service
sudo systemctl start lizardo-metrics.service

# Check the service status
sudo systemctl status lizardo-metrics.service
Your status output should look something like this:
pi@lizardo:~ $ sudo systemctl status lizardo-metrics.service
● lizardo-metrics.service - SHT30 Sensor Metrics Service
     Loaded: loaded (/home/pi/github.com/lizardo/lizardo-metrics.service; enabled; vendor preset: enabled)
     Active: active (running) since Fri 2022-01-21 21:04:35 GMT; 2 days ago
   Main PID: 469 (python3)
      Tasks: 2 (limit: 1935)
        CPU: 7h 32min 30.074s
     CGroup: /system.slice/lizardo-metrics.service
             └─469 python3 /opt/lizardo-metrics/lizardodaemon.py

Jan 24 20:08:11 lizardo /opt/lizardo-metrics/lizardodaemon.py[469]: Sensor 1 - Temp:95.4*F, Humidity: 20.8%
Jan 24 20:08:11 lizardo /opt/lizardo-metrics/lizardodaemon.py[469]: Sensor 0 - Temp:85.1*F, Humidity: 26.0%
Jan 24 20:08:11 lizardo /opt/lizardo-metrics/lizardodaemon.py[469]: Sensor 1 - Temp:95.4*F, Humidity: 20.8%
With the service running, you should also be able to access the prometheus http endpoint being hosted by the service:
pi@lizardo:~ $ curl localhost:8000

...

sht30_humidity_percent{scale="sensor0_humidity"} 25.97390707255665
sht30_humidity_percent{scale="sensor1_humidity"} 20.711070420386054
# HELP sht30_temperature Temperature measured by the SHT30 Sensors
# TYPE sht30_temperature gauge
sht30_temperature{scale="sensor0_fahrenheit"} 85.11352712291142
sht30_temperature{scale="sensor1_fahrenheit"} 95.32753490501258
Scraping with Prometheus
Great! We have our data being read from the sensors and it’s available for Prometheus to scrape. Like I mentioned above, I’m already running an AKS cluster with Kube-Prometheus, so I wanted to use that.
This part took me a little time to work out, but it makes sense now that I’ve dug in a bit. Hopefully I can help you make this easier. The prometheus operator in kube-promethes will scrape any service you are running in your Kubernetes cluster. You just need to tell it where it is via a Service Monitor configuration. But…..I don’t have a Kubernetes Service!!!! I have a raspberry pi that is hosting an endpoint accessible from my cluster.
The good news is that Kubernetes has you covered. In the end, a Service is just an abstraction on top of ‘Endpoints’. An endpoint is an IP address that Kubernetes will route traffic to when you try to call a Service. Usually Kubernetes will create and manage the endpoints for you when you expose something from your cluster, but you can also manually configure the endpoint and service. So you can create an endpoint definition that points OUTSIDE of your cluster, and then expose that to resource INSIDE your cluster via a Service. Once you have a Service the prometheus operator can see it and scrape it.
Lets look at the three files that make this work.
IMPORTANT: I learned the hard way that the resource names matter. I recommend you name all three the same, or the prometheus operator may not find your endpoint.
The Endpoint
Here we create an endpoint with a single IP address that points to our raspberry pi IP, and exposes port 8000, which is the port hosting our prometheus http service.
apiVersion: v1
kind: Endpoints
metadata:
  name: lizardo-metrics
  namespace: monitoring
  labels:
    k8s-app: lizardo
subsets:
  - addresses:
      - ip: 192.168.1.104
    ports:
      - name: metrics
        port: 8000
        protocol: TCP
The Service
Here we connect the Kubernetes Service to the Endpoint, using the ExternalName type and the pi IP as the externalName.
apiVersion: v1
kind: Service
metadata:
  name: lizardo-metrics
  namespace: monitoring
  labels:
      k8s-app: lizardo
spec:
  type: ExternalName
  externalName: 192.168.1.104
  ports:
  - name: metrics
    port: 8000
    protocol: TCP
    targetPort: 8000
The Service Monitor
Finally, we set up the service monitor and tell it the namespace (monitoring) and service label (k8s-app: lizardo) that it should look at to scrape.
apiVersion: monitoring.coreos.com/v1
kind: ServiceMonitor
metadata:
  name: lizardo-metrics
  namespace: monitoring
  labels:
    k8s-app: lizardo
spec:
  selector:
    matchLabels:
      k8s-app: lizardo
  namespaceSelector:
    matchNames:
      - monitoring
  endpoints:
  - port: metrics
    interval: 10s
    honorLabels: true
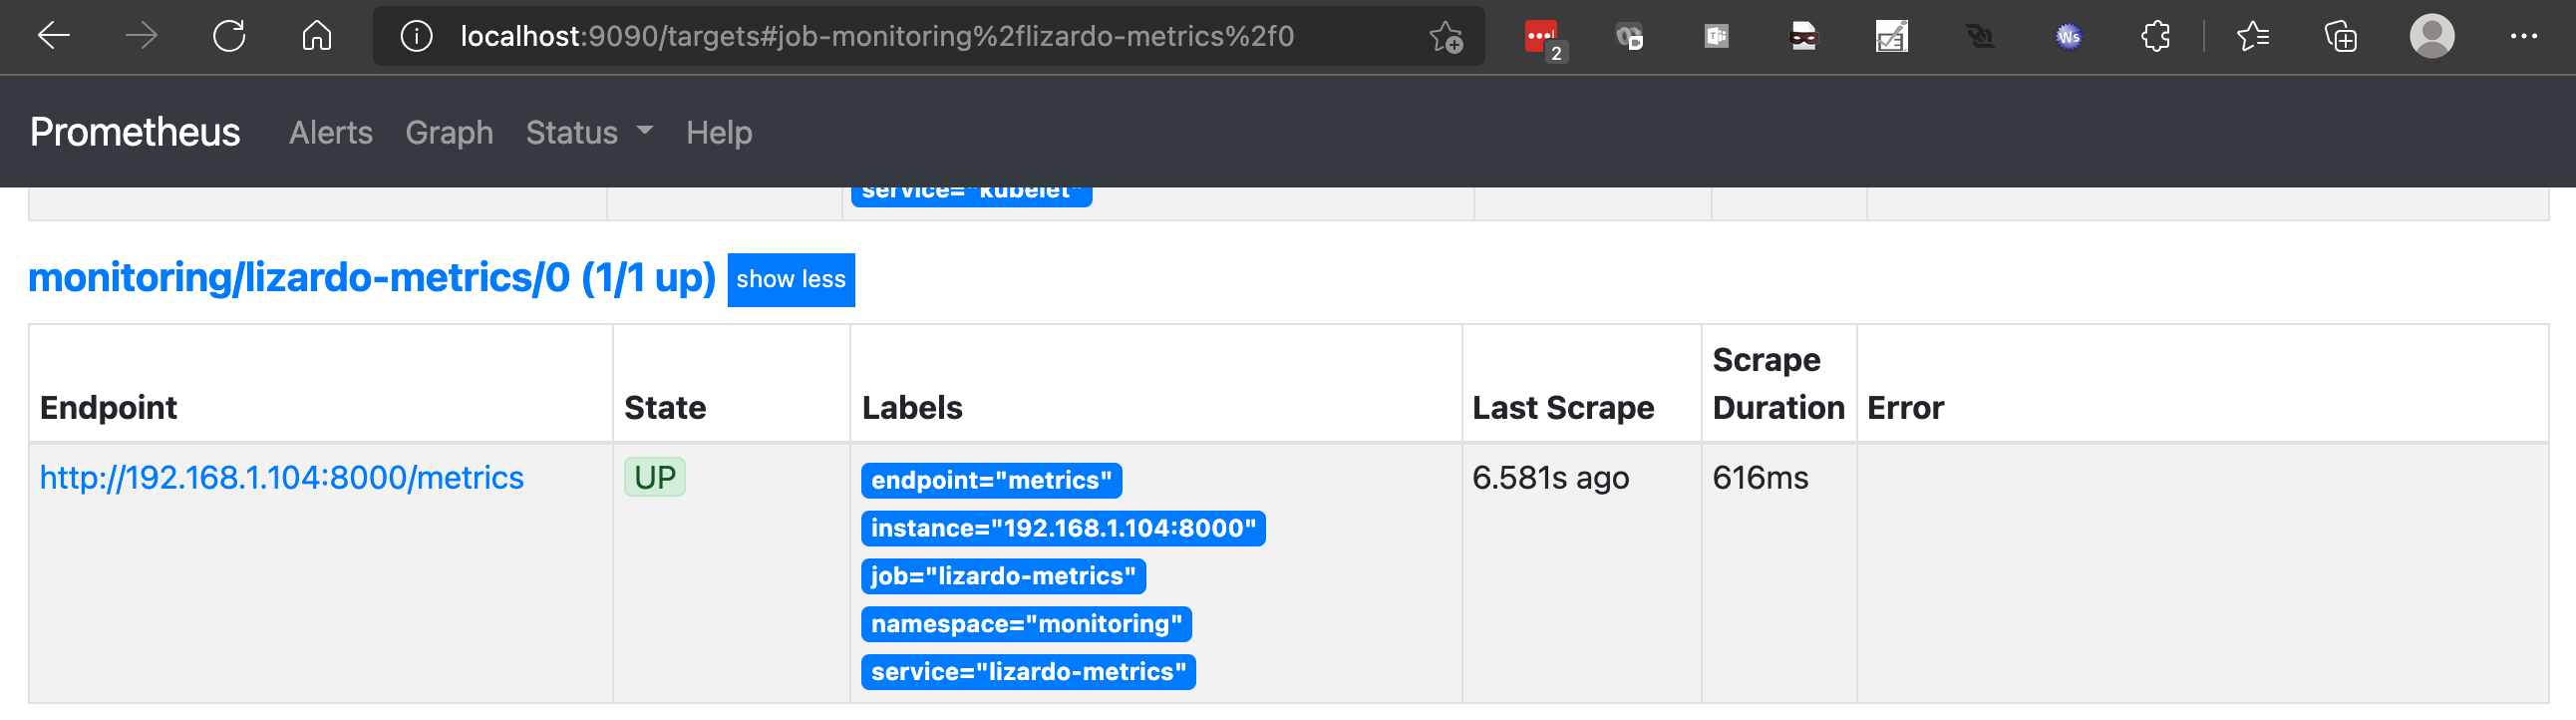
We can now jump out to the Prometheus UI and validate that the endpoint is being scraped. I don’t expose the prometheus service externally, so I’ll use a port forward:
kubectl port-forward svc/prometheus-k8s -n monitoring 9090:9090
Forwarding from 127.0.0.1:9090 -> 9090
Forwarding from [::1]:9090 -> 9090
Grafana
Now, finally, for the fun part. Let’s open up Grafana and see what we can see! I do have grafana externally accessible, so no need to port-forward, but you obviously can if needed.
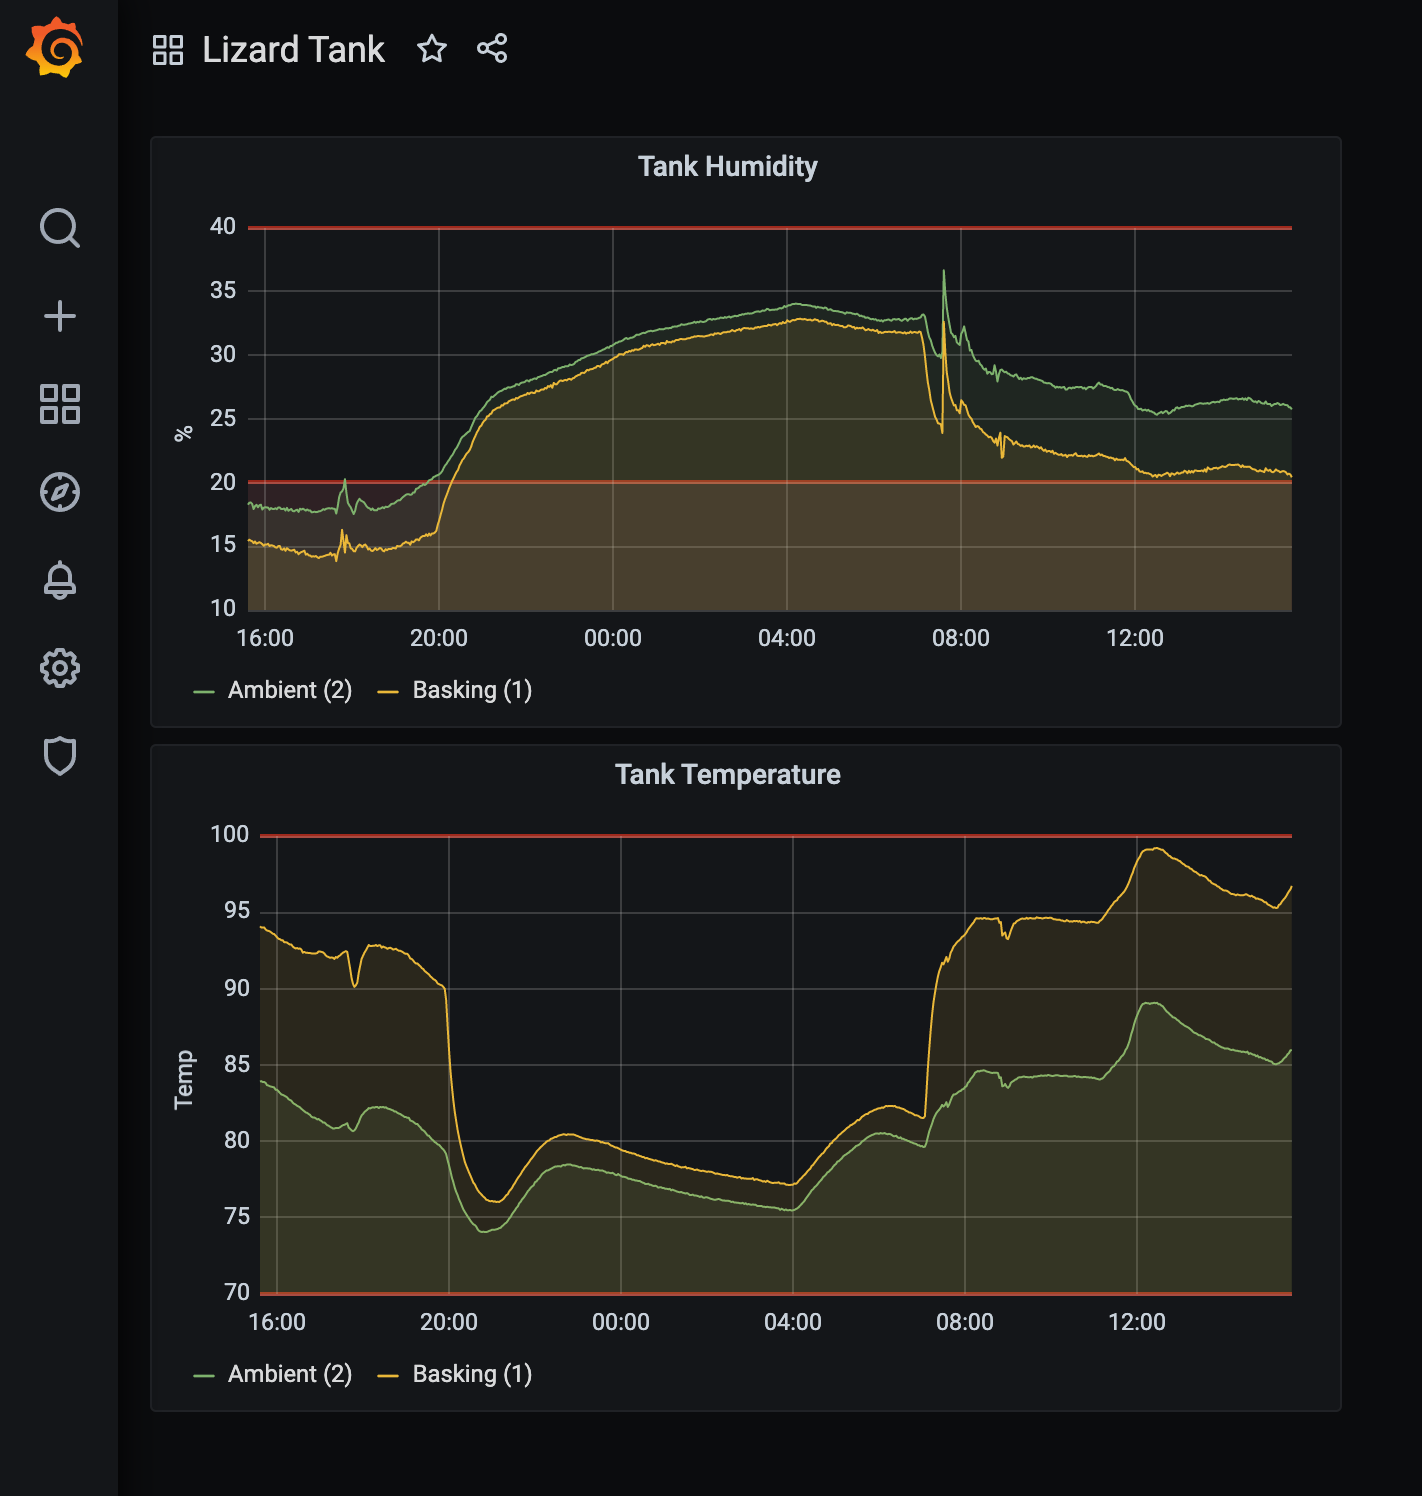
I wanted two charts. Temperature and Humidity. Since we’re tracking the ‘basking’ side separately from the ‘ambient’ side, I thought I’d put both in the same chart, so we can see the comparison between temp and humidity in the two sides of the tank more clearly.
Here are the steps:
- Click on the “+” on the left part of the Grafana screen and ‘Create Dashboard’
- Click ‘Add New Panel’
- In the query pane, select ‘prometheus’ as your data source
- In the ‘metrics’ box, start to type ‘sht’ and you should see it come back with your two data sets (sht30_humidity_percent and sht30_temperature)
- Choose one and then mess around with the visualization until you have it looking the way you like
When I was playing with the visualizations I did a few things. First, I opened up the overrides and I set an override for each metric to customize the ‘Display Name’ property. I also set ‘threshold’ values, which helps me visualize when the temperature or humidity are getting out of a preferred range (I’ll alert on this later).
Conclusion
I hope this helps someone out there get up and running a bit faster. In the end, the few take aways to make this easier on yourself would be:
- Figure out your target programing language, and see if you can find sensors that already have examples and SDKs available for that language
- Don’t forget that I2C sensors are statically address, so you if you’re using many of the same sensor, you will likely need to find a way to change the address (some sensors have jumper options) or use an I2C multiplexer
- When creating endpoints and services for the prometheus operator service monitor to scrape, the resource names need to match between the endpoint and the service definition
- The SHT30 sensors wires are pretty short, so make sure you get some good wire to allow you to lengthen that connection. I recommend some 4-wire ribbon to keep things looking clean.
In the future I’ll be updating this to include the web cam, and will possibly enable some alerting. If I get around to that, I’ll post that as well.